
How to Look Up Spokane County Jail Population Data
The county posts detention metrics on a public dashboard. It is built in Power BI and is meant to show current detention figures rather than a single yearly report. The dashboard is the best official source for the live county count, and it sits on the county website with the rest of Detention Services.
You read the dashboard, you do not search it by name. It shows aggregate numbers for the system, not individual records. The county hosts it on the Detention Services Dashboard page.
Because the dashboard is an embedded report, the exact figures update on the county's schedule, so the count you see is a recent snapshot rather than a fixed total.
Two-Facility System Overview
Spokane County Detention Services runs two facilities in the Spokane area. One is the main county jail downtown; the other is Geiger Corrections Center to the west. The two sites share food service and some programs, but they hold different parts of the population. The jail handles intake and higher-need custody, while Geiger holds corrections-level inmates and some on monitoring.
The roster's Status column reflects this split. It marks people as a jail inmate, a Geiger facility inmate, or Geiger facility EHM, which is electronic home monitoring. EHM people are counted as supervised but are not housed in a Detention Services bed. That distinction matters for any population figure, because monitoring caseload is not the same as the housed count.
Geiger sits at 3507 S Spotted Road, west of the city, while the main jail sits downtown on West Mallon Avenue. The two work as one system for food and some programs, but they keep separate rosters and separate housing. A person can move between them as a case changes, so a single name's status may shift over a stay. The dashboard counts both sites together for the headline figure.
Average Daily Population in Spokane County
The clearest official figure is the combined average daily population. The county states that its two facilities together hold more than 700 people on an average day. That number is a system total, not a per-facility split, and the county does not break it out by site in the text-readable pages.
Average daily population, or ADP, is the mean head count over a period. It smooths out the daily swings from bookings and releases. The county publishes the over-700 ADP figure on its Detention Services Facilities page, the same page that names the two sites.
So the headline county number is simple: two facilities, more than 700 people on a typical day, with the live count on the dashboard.
Spokane County Jail Capacity Overview
Capacity is where the official record thins out. The county names its two facilities and the combined ADP, but the per-facility rated capacity was not found in the county sources reviewed. The table below sets out what is known and marks the gaps plainly, so the numbers are not mistaken for hard capacity counts.
| Facility | Official capacity located? | Population note |
|---|---|---|
| Spokane County Jail | Not located in county sources | Part of the two-facility system; combined ADP over 700. |
| Geiger Corrections Center | Not located in county sources | Holds Geiger facility inmates and Geiger facility EHM. |
| Combined Detention Services | Not located in county sources | Average daily population more than 700 per the county Facilities page. |
Anyone who needs a firm capacity figure should read it off the live dashboard or a county budget report rather than treat the ADP as a cap. ADP is a count of people held, not a measure of how many beds exist.
Note: Official per-facility rated capacity for the Spokane County Jail and Geiger was not located in county sources, so only the combined average daily population is reported here.
Pretrial and Sentenced Population
Jail populations usually split into pretrial and sentenced groups. Pretrial people are held while their case is open and have not been convicted. Sentenced people are serving time after a conviction, often a misdemeanor or gross misdemeanor term in a county jail. A felony sentence generally moves a person to state prison instead.
That same logic separates misdemeanor from felony holds at the county level. The county jail mainly holds people on local cases and pretrial felony holds, while sentenced felons go to the Department of Corrections. The exact county split between pretrial and sentenced, and between misdemeanor and felony, was not found as a published figure in the county sources reviewed.
So the structure is clear even where the county-specific percentages are not. For a live look, the dashboard is the place to check; the over-700 ADP is the only firm county total found.
Why the split matters is plain enough. A jail that holds mostly pretrial people responds to court speed and bond practice, while a jail that holds many sentenced people responds to charging and sentencing. Misdemeanor holds tend to be short; felony holds tend to be longer or end in a prison transfer. The county does not publish these shares in plain text, so the dashboard or a budget report is the place to confirm them rather than any figure stated here.
EHM and Housed Population
Not every person on the roster takes up a bed. Electronic home monitoring lets some people serve under community custody, watched by radio frequency or GPS. They show on the roster with a Geiger facility EHM status, but they live at home, not in a facility.
This matters for reading any population figure. The housed count is the number of people in actual beds across the two sites. The supervised count adds EHM people on top of that. The ADP figure tracks housed inmates, so EHM caseload should be read as a separate layer, not folded into the bed count.
Food Service and Inmate Workers
The scale of the population shows up in the kitchen. Detention Services runs food service as one unit across the jail and Geiger. The county reports that the two facilities produce more than 700,000 meals a year, including meals for housed inmates and food support for work crew and work release, plus contracted meals for the county's juvenile detention.
The kitchen also runs on inmate labor. The county says more than 70 inmate workers a day take part in meal production. That work doubles as a program, since it builds skills and structure for the people who join it.
The meal count is a useful proxy. More than 700,000 meals a year across two sites lines up with a housed population in the hundreds fed three times a day, plus the work crew, work release, and juvenile support the county folds into the same kitchen. It is not a head count on its own, but it tracks the scale of the people the system feeds each day.
The county describes the food and commissary operation on its Food Service and Commissary page.
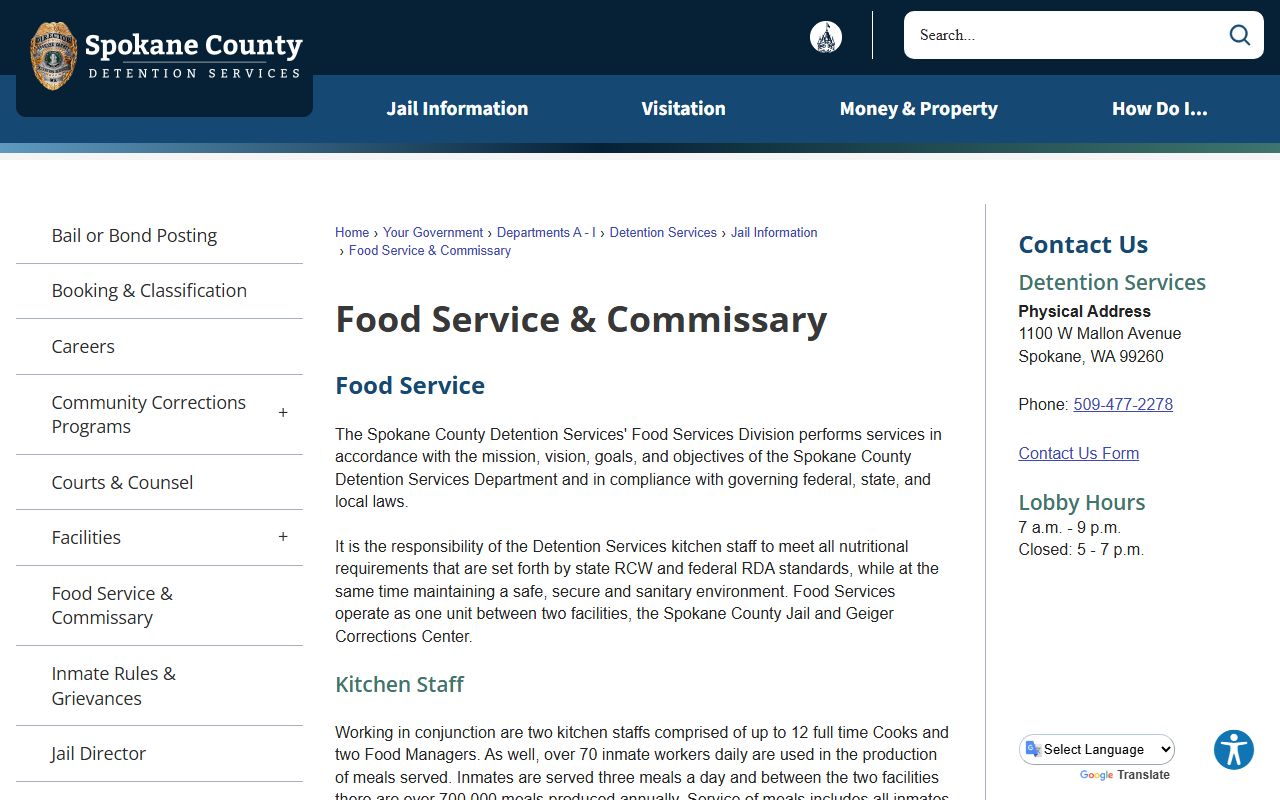
These figures scale with the head count, so they offer a rough sense of how large the housed population runs.
Community Corrections Programs
The county uses programs to hold down the population over time. Geiger runs community corrections tracks meant to lower the number of people who cycle back into jail. The list includes parenting, cognitive programs, GED study, drug and alcohol treatment, community service, work crews, and work release.
A planned downtown community corrections center is set to add more of this work. Work release and EHM also shift people out of beds while they keep jobs or treatment going. Each of these levers nudges the housed count down without changing who is under the county's watch.
These tracks tie back to the population in a direct way. Work crews and work release move people out of beds during the day, and EHM moves them out entirely while still on the books. Treatment and GED tracks aim at the longer goal of fewer returns. Read together, the program list explains how the county tries to manage a count that would otherwise drift up with each booking cycle.
National and State Context
County numbers read better against a national backdrop. The U.S. Bureau of Justice Statistics, or BJS, publishes national jail data, including population counts, incarceration rates per 100,000 residents, and pretrial shares. Those national figures are not Spokane County figures, and they should not be read as a county count.
The comparison below frames the idea. It marks clearly which figure is local and which is national, since mixing the two would be misleading.
| Measure | Spokane County | National (BJS) |
|---|---|---|
| Source | County Detention Services pages and dashboard | BJS national jail series |
| Population figure | Combined ADP over 700 | National totals and rates per 100,000 |
| Pretrial / sentenced split | Not published in county sources reviewed | Reported in national series |
| Use | Local count and live dashboard | Broad context only |
BJS data lives on the Bureau of Justice Statistics site, which is the right place for national rates.
Use the national series for scale, then return to the county dashboard for the actual local count. A national rate per 100,000 residents can hint at where a county might sit, but it cannot stand in for the county's own figure.
The safest reading keeps the two apart. The county reports a two-facility system with a combined ADP over 700 and maintains a live dashboard for current metrics. Anything finer, such as a pretrial share or a demographic breakdown, should come from the dashboard or a county budget report, with BJS used only for broad context.
Searching for Inmate Records by Name
This page covers population data, not individual lookups. To find a specific person, their bond, or their charges, use the jail roster instead. The full how-to and the profile field list are on the Spokane County inmate records page.